Trainings and Courses

3rd Workshop Information Visualization with Omix

November 7-8, Jülich
Regular Registration: September 30, 2013

Organized by
Modeling and Simulation Group
Institute of Bio- and Geosciences 1: Biotechnology 2
Forschungszentrum Jülich

omixCourse2012

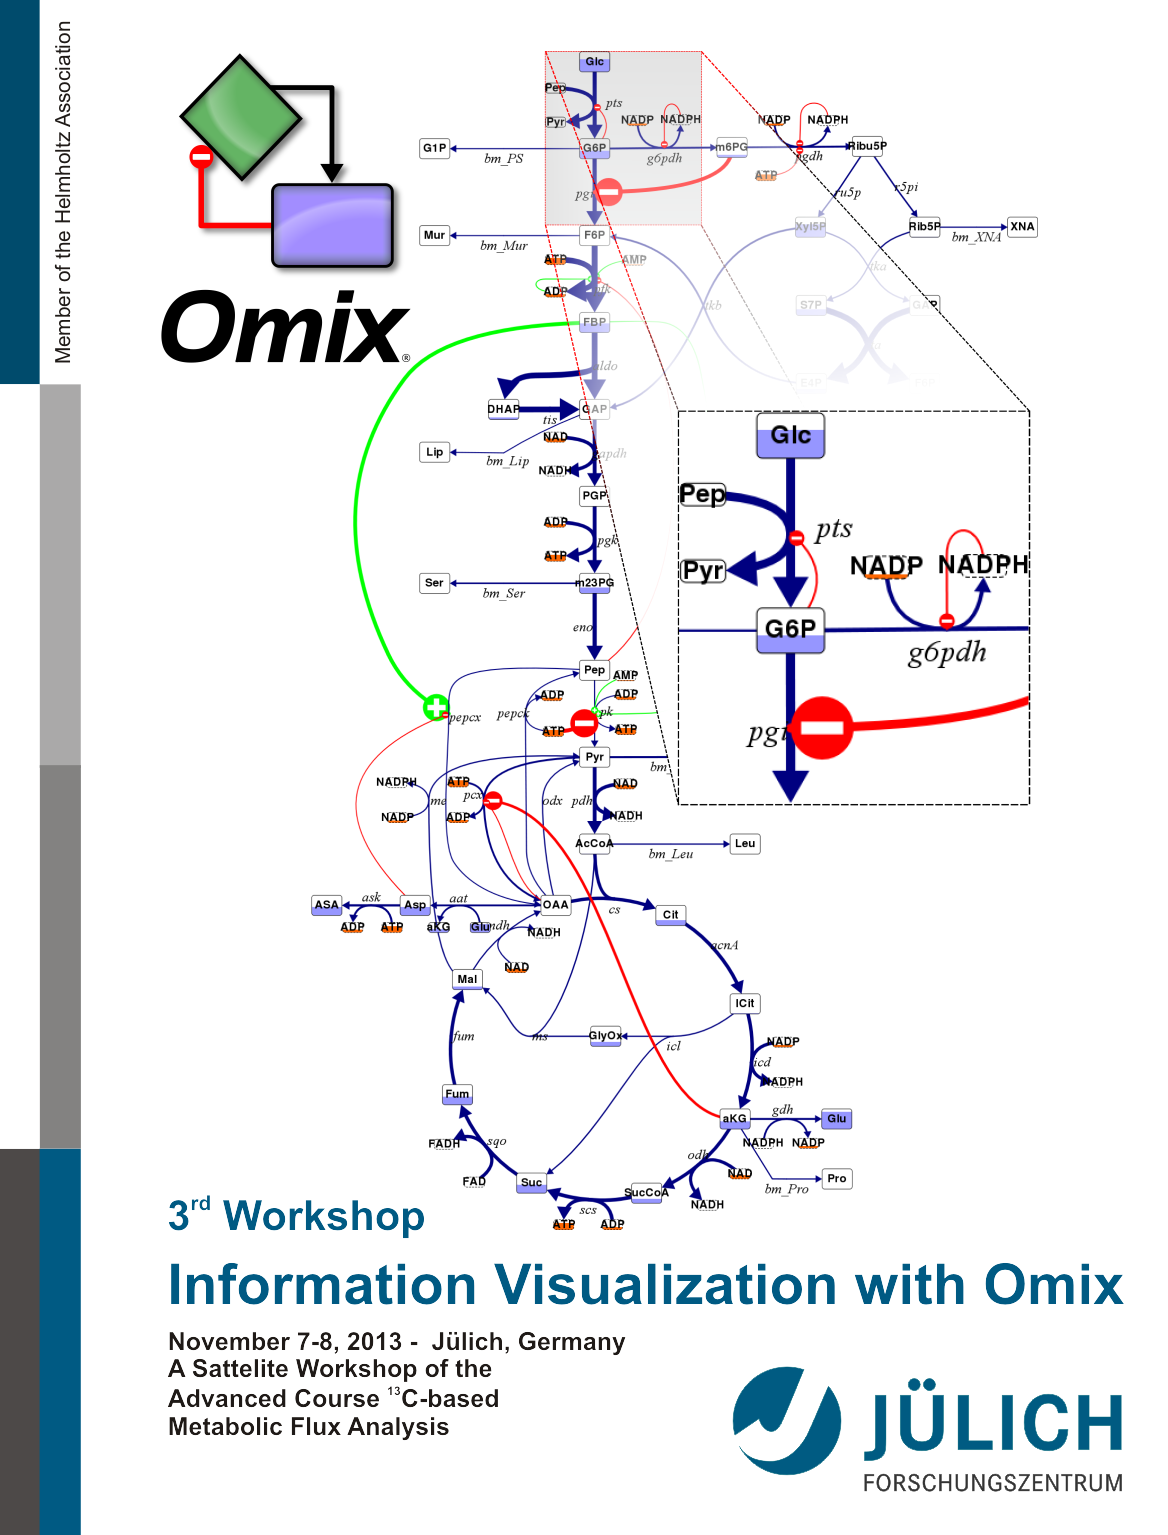
The third Workshop Information Visualization with Omix takes place on November 7 and 8 at Forschungszentrum Jülich, IBG-1. Omix® is a user-friendly and highly customizable editor for metabolic network diagrams, equipped with extensive data visualization features. Main fields of application are the interactive mapping of multi-omics data in the direct context of network drawings, in particular in the fields of transcriptomics, metabolomics and fluxomics. Omix is already in use by more than 150 groups worldwide.

Omix' unique features include (but are not limited to):

  • Drawing stylish network diagrams with extensive annotation potential
  • Simple and fast access to Omix is warranted, even for newcomers
  • Interactive visualization of network models on different levels of detail
  • Semi-automatic drawing features support the drawing process
  • Export of the drawings into bitmap and vector graphic formats like PNG, JPG and SVG as well as animations (SWF Flash) and movie files (AVI)
  • Import of reaction equations
  • Visualization of chemical structures
  • Interactive network analysis
  • 3D visualization of data and network topologies
  • Manuals, tutorial and many example applications available

An outstanding feature of Omix is OVL, an object-oriented scripting engine that allows programming of network diagrams. For example, OVL enables the user to define interaction with the network diagram and dynamic modification of the attributes of all graphical elements in a drawing according to available data from experiment and simulation. This way, time-dependent numerical data is easily animated in the context of network diagrams.


A number of plug-ins exist that extend Omix by interfaces to important data exchange formats like Excel and SBML, to the KEGG data bases and to simulators like MATLAB, Dymola and, especially, to 13CFLUX2. Omix is a versatile multi-purpose graphical modeling tool and evolved to a rich visual front- and backend for the 13C Metabolic Flux Analysis.

The workshop addresses researchers of all disciplines that are interested in information visualization in the context of biochemical networks. In two days, they will learn how to create high-qualitative network diagrams and how to visualize data with Omix. Furthermore, an overview is given about all available Omix plug-ins. The participants are encouraged to bring their own networks and data to acquire individual visualization solutions with Omix. Each participant requires a Laptop for the practical exercises.

The tutorial course is organized by the Modeling & Simulation group at the IBG-1: Biotechnology.


icons by famfamfam.com last change: 29.09.2023 | | Print